impact

[vc_section full_width=”stretch_row” css=”.vc_custom_1546981179289{background-color: rgba(124,124,124,0.1) !important;*background-color: rgb(124,124,124) !important;}”][vc_row equal_height=”yes” overflow=”default” css=”.vc_custom_1552660104371{padding-top: 10px !important;padding-bottom: 10px !important;}”][vc_column][vcj_heading heading=”h1″ style=”style1″ text_color=”#0099a8″ hover_color=”#0099a8″ size=”default” animation_speed=”2″ animation_delay=”0″]Executive Summary[/vcj_heading][vcj_empty_space height=”16px”][vcj_heading heading=”h1″ style=”style1″ weight=”300″ size=”custom” desktop_size=”16px” line_height=”30px” animation_speed=”2″ animation_delay=”0″]The Houston Land Bank has brought $37,682,335 in property value back to the market. For several years, the Houston Land Bank has continued to acquire and sell properties for market sale; the cumulative effect of our activities has led to more tax revenue that goes directly to help public schools, the City of Houston, and Harris County to improve their programming. Our activities have also provided opportunity for residents to build wealth through homeownership.[/vcj_heading][vcj_empty_space][/vc_column][/vc_row][/vc_section][vc_section full_width=”stretch_row” css=”.vc_custom_1546981219711{background-color: #ffffff !important;}”][vc_row equal_height=”yes”][vc_column][vcj_empty_space][vcj_heading heading=”h1″ style=”style1″ text_color=”#0099a8″ hover_color=”#0099a8″ weight=”300″ size=”custom” desktop_size=”16px” line_height=”30px” animation_speed=”2″ animation_delay=”0″]

Our work increases city-wide property value and tax revenue while also improving the quality of life for our hardest hit communities.

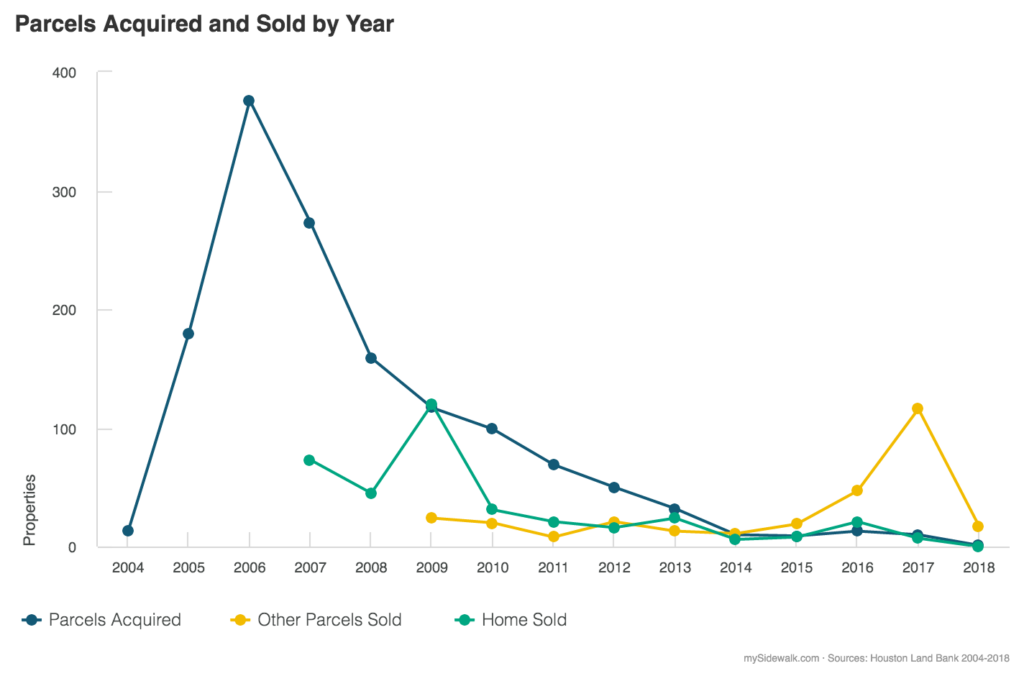
[/vcj_heading][vc_column_text css=”.vc_custom_1548436460290{margin-top: 10px !important;}”]Below are the major outcomes of the Houston Land Bank’s work from 2004 to April 2018. They provide a snapshot of how we measure progress, and will be updated annually as data becomes available.[/vc_column_text][vcj_empty_space][/vc_column][/vc_row][vc_row equal_height=”yes”][vc_column width=”1/4″][vcj_heading heading=”h4″ style=”style1″ weight=”300″ size=”m” animation_speed=”2″ animation_delay=”0″]Land Bank Activity 2004 – 2018[/vcj_heading][vc_column_text css=”.vc_custom_1548436583179{margin-top: 10px !important;}”]The line chart below shows Land Bank activity from 2004 to 2018. The dark blue line represents acquisitions, the yellow line represents parcel sales, and the green line represents homes sold.[/vc_column_text][/vc_column][vc_column width=”3/4″][vc_single_image image=”10008″ img_size=”large”][/vc_column][/vc_row][/vc_section][vc_section full_width=”stretch_row” css=”.vc_custom_1546981219711{background-color: #ffffff !important;}”][vc_row][vc_column][vcj_empty_space][vc_separator border_width=”2″][vcj_empty_space][/vc_column][/vc_row][vc_row equal_height=”yes”][vc_column width=”3/4″][vc_single_image image=”10068″ img_size=”large”][/vc_column][vc_column width=”1/4″][vcj_heading heading=”h3″ style=”style1″ weight=”300″ size=”custom” desktop_size=”16px” line_height=”30px” animation_speed=”2″ animation_delay=”0″]

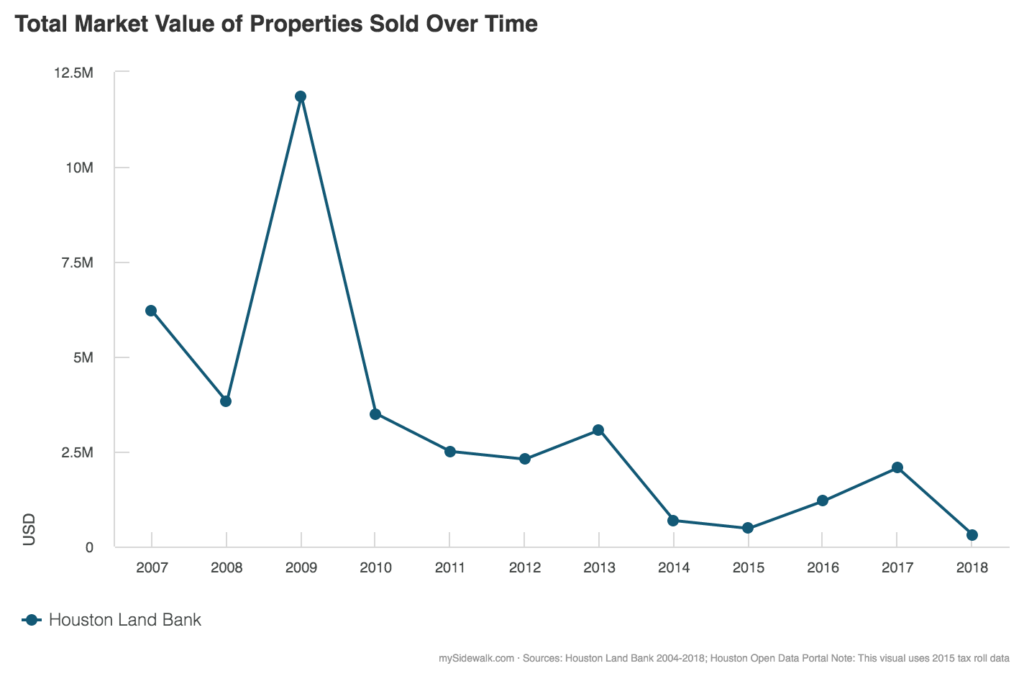
Houston Land Bank brings millions in property value back to the market each year.

[/vcj_heading][vc_column_text css=”.vc_custom_1548436570474{margin-top: 10px !important;}”]Since 2007, the Houston Land Bank has brought $37,682,335 in property value back to the market. For several years, the Houston Land Bank has continued to acquire and flip properties for market sale; the cumulative effect of our activities can provide insight of what can be achieved in our next chapter.[/vc_column_text][vcj_heading heading=”h4″ style=”style1″ weight=”300″ size=”m” animation_speed=”2″ animation_delay=”0″]

Total Property Value Reentered into Market

[/vcj_heading][vcj_heading heading=”h1″ margin=”-15px 0px 0px 0px” style=”style1″ text_color=”#0099a8″ hover_color=”#0099a8″ weight=”300″ size=”l” animation_speed=”2″ animation_delay=”0″]$37,682,335[/vcj_heading][vc_column_text]Houston, TX[/vc_column_text][/vc_column][/vc_row][vc_row equal_height=”yes”][vc_column][vcj_empty_space][/vc_column][/vc_row][/vc_section][vc_section full_width=”stretch_row” css=”.vc_custom_1547069682013{background-color: #0099a8 !important;}”][vc_row equal_height=”yes”][vc_column][vcj_empty_space height=”48″][/vc_column][/vc_row][vc_row equal_height=”yes”][vc_column][vcj_heading heading=”h1″ style=”style1″ text_color=”#ffffff” hover_color=”#ffffff” weight=”300″ size=”custom” desktop_size=”16px” line_height=”30px” animation_speed=”2″ animation_delay=”0″]

Houston Land Bank activity leads to better schools, and a better city.

[/vcj_heading][vcj_text_block paragraph_whitespace=”1″ text_color=”#ffffff” margin=”15px 0px 0px 0px”]Land Bank work results in more tax revenue that goes directly to help public schools, the City of Houston, and Harris County to improve their programming. Below is the yearly revenue each entity receives due to the Houston Land Bank.[/vcj_text_block][vcj_empty_space height=”65px”][vcj_heading heading=”h4″ style=”style1″ text_color=”#ffffff” hover_color=”#ffffff” size=”m” animation_speed=”2″ animation_delay=”0″]Yearly Property Tax Revenue Added[/vcj_heading][vcj_empty_space][/vc_column][/vc_row][vc_row equal_height=”yes”][vc_column width=”1/4″][vcj_heading heading=”h5″ style=”style1″ text_color=”#ffffff” hover_color=”#ffffff” weight=”300″ size=”custom” desktop_size=”16px” line_height=”30px” animation_speed=”2″ animation_delay=”0″]

Independent School Districts

[/vcj_heading][vcj_heading heading=”h1″ margin=”-15px 0px 0px 0px” style=”style1″ text_color=”#ffffff” hover_color=”#ffffff” weight=”300″ size=”l” animation_speed=”2″ animation_delay=”0″]$328,402.42[/vcj_heading][vcj_text_block paragraph_whitespace=”1″ text_color=”#e2e2e2″]Houston, TX[/vcj_text_block][/vc_column][vc_column width=”1/4″][vcj_heading heading=”h5″ style=”style1″ text_color=”#ffffff” hover_color=”#ffffff” weight=”300″ size=”custom” desktop_size=”16px” line_height=”30px” animation_speed=”2″ animation_delay=”0″]

City of Houston

[/vcj_heading][vcj_heading heading=”h1″ margin=”-15px 0px 0px 0px” style=”style1″ text_color=”#ffffff” hover_color=”#ffffff” weight=”300″ size=”l” animation_speed=”2″ animation_delay=”0″]$192,321.56[/vcj_heading][vcj_text_block paragraph_whitespace=”1″ text_color=”#e2e2e2″]Houston, TX[/vcj_text_block][/vc_column][vc_column width=”1/4″][vcj_heading heading=”h5″ style=”style1″ text_color=”#ffffff” hover_color=”#ffffff” weight=”300″ size=”custom” desktop_size=”16px” line_height=”30px” animation_speed=”2″ animation_delay=”0″]

Community College

[/vcj_heading][vcj_heading heading=”h1″ margin=”-15px 0px 0px 0px” style=”style1″ text_color=”#ffffff” hover_color=”#ffffff” weight=”300″ size=”l” animation_speed=”2″ animation_delay=”0″]$32,663.03[/vcj_heading][vcj_text_block paragraph_whitespace=”1″ text_color=”#e2e2e2″]Houston, TX[/vcj_text_block][/vc_column][vc_column width=”1/4″][vcj_heading heading=”h5″ style=”style1″ text_color=”#ffffff” hover_color=”#ffffff” weight=”300″ size=”custom” desktop_size=”16px” line_height=”30px” animation_speed=”2″ animation_delay=”0″]

Harris County

[/vcj_heading][vcj_heading heading=”h1″ margin=”-15px 0px 0px 0px” style=”style1″ text_color=”#ffffff” hover_color=”#ffffff” weight=”300″ size=”l” animation_speed=”2″ animation_delay=”0″]$124,898.25[/vcj_heading][vcj_text_block paragraph_whitespace=”1″ text_color=”#e2e2e2″]Houston, TX[/vcj_text_block][/vc_column][/vc_row][vc_row equal_height=”yes”][vc_column][vcj_empty_space height=”65″][/vc_column][/vc_row][/vc_section][vc_section full_width=”stretch_row”][vc_row][vc_column][vcj_empty_space][/vc_column][/vc_row][vc_row equal_height=”yes”][vc_column width=”1/4″][vcj_heading heading=”h3″ style=”style1″ text_color=”#0099a8″ hover_color=”#0099a8″ weight=”300″ size=”custom” desktop_size=”16px” line_height=”30px” animation_speed=”2″ animation_delay=”0″]

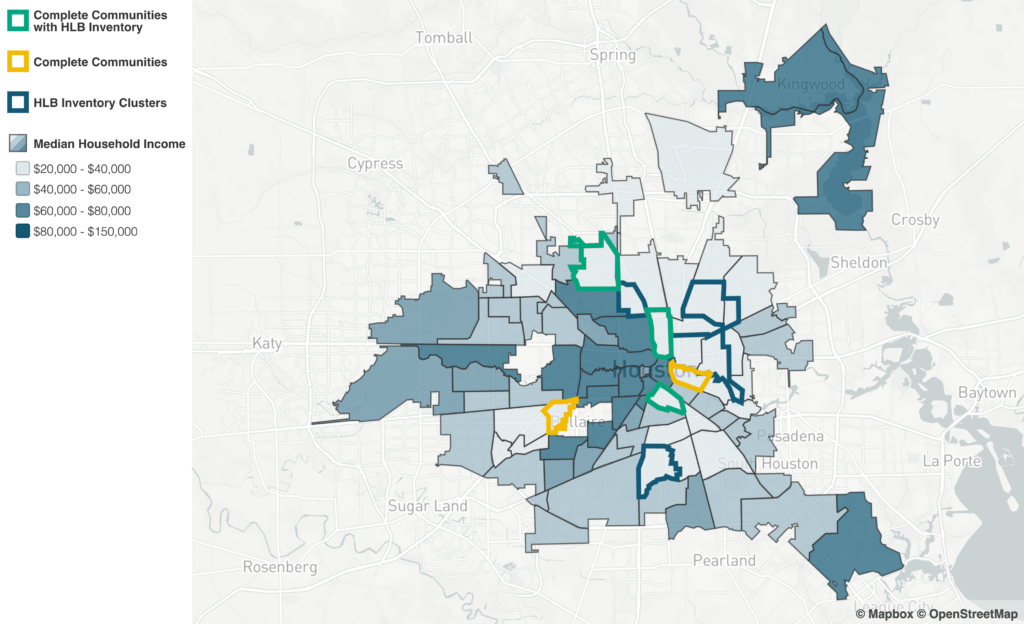
We work where the community needs investment and increased local wealth.

[/vcj_heading][vc_column_text css=”.vc_custom_1548436528591{margin-top: 10px !important;}”]The Houston Land Bank works with neighborhoods in need of community reinvestment. The map below shows the income gap between Land Bank active neighborhoods to date and the rest of the city.[/vc_column_text][/vc_column][vc_column width=”3/4″][vc_single_image image=”10096″ img_size=”large” alignment=”center”][/vc_column][/vc_row][vc_row][vc_column][vcj_empty_space][vc_separator border_width=”2″][vcj_empty_space][/vc_column][/vc_row][/vc_section][vc_row equal_height=”yes”][vc_column width=”3/4″][vc_single_image image=”10071″ img_size=”large” alignment=”center”][/vc_column][vc_column width=”1/4″][vcj_heading heading=”h3″ style=”style1″ text_color=”#0099a8″ hover_color=”#0099a8″ weight=”300″ size=”custom” desktop_size=”18px” line_height=”30px” animation_speed=”2″ animation_delay=”0″]

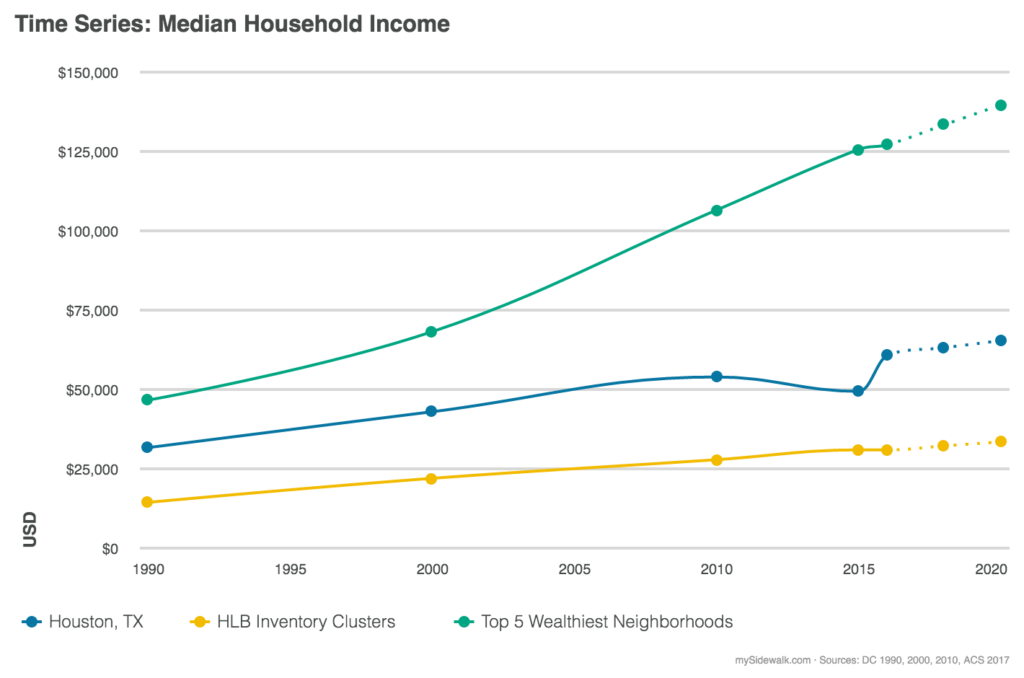
The Houston Land Bank provides opportunity for residents to build wealth through homeownership.

[/vcj_heading][vc_column_text css=”.vc_custom_1548436540192{margin-top: 10px !important;}”]To date, the Houston Land Bank’s active neighborhoods have been among the lowest income areas in the city for nearly 4 decades. Even worse, the gap between our targeted neighborhoods and the 5 wealthiest continues to grow. This inequality highlights that the private market has failed to respond to the needs of Houston residents in our active neighborhoods to date. Our work, however, helps build community and improve quality of life for those that need it most.[/vc_column_text][/vc_column][/vc_row][vc_row][vc_column][vcj_empty_space][vc_separator border_width=”2″][vcj_empty_space][/vc_column][/vc_row][vc_row equal_height=”yes”][vc_column width=”1/4″][vcj_heading heading=”h1″ style=”style1″ text_color=”#0099a8″ hover_color=”#0099a8″ weight=”300″ size=”custom” desktop_size=”16px” line_height=”30px” animation_speed=”2″ animation_delay=”0″]

Over $7,000,000 of value is ready to reenter the market

[/vcj_heading][vc_column_text css=”.vc_custom_1548436551643{margin-top: 10px !important;}”]Based on our current inventory, the Houston Land Bank is able to reintroduce over $7,000,000 back into the market. To achieve this, a new phase of programming will take underutilized and tax foreclosed properties and re-enter these back into tax productive status. This creates value for Houston’s residents, the City, and the County.[/vc_column_text][vcj_heading heading=”h4″ style=”style1″ weight=”300″ size=”m” animation_speed=”2″ animation_delay=”0″]

Market Value of Current Inventory

[/vcj_heading][vcj_heading heading=”h1″ margin=”-15px 0px 0px 0px” style=”style1″ text_color=”#0099a8″ hover_color=”#0099a8″ weight=”300″ size=”l” animation_speed=”2″ animation_delay=”0″]$7,181,564[/vcj_heading][vc_column_text]Houston, TX[/vc_column_text][/vc_column][vc_column width=”3/4″][vc_single_image image=”10087″ img_size=”large”][/vc_column][/vc_row][vc_row][vc_column][vcj_empty_space][vcj_text_block paragraph_whitespace=”1″ text_size=”16px”]

Read more at mySidewalk.com

[/vcj_text_block][vcj_empty_space][/vc_column][/vc_row]